On-chain analytics platform Artemis reports that Ethereum has attracted $2.1 billion in net capital flows year-to-date in 2026, as of March 10, 2026, placing it ahead of every other blockchain by this measure. The data tracks capital movement across DeFi bridges, both canonical and application-specific, capturing where liquidity is entering and leaving across ecosystems.
The number is striking because it arrives during a period when everything else about Ethereum looks bleak. ETH has fallen more than 60% from its August 2025 all-time high of $4,953. ETF investors have pulled $2.76 billion over the past four months. The Fear & Greed Index sits at 12, deep in extreme fear territory. And yet, bridge flow data tells a different story: capital is choosing Ethereum over every other chain.
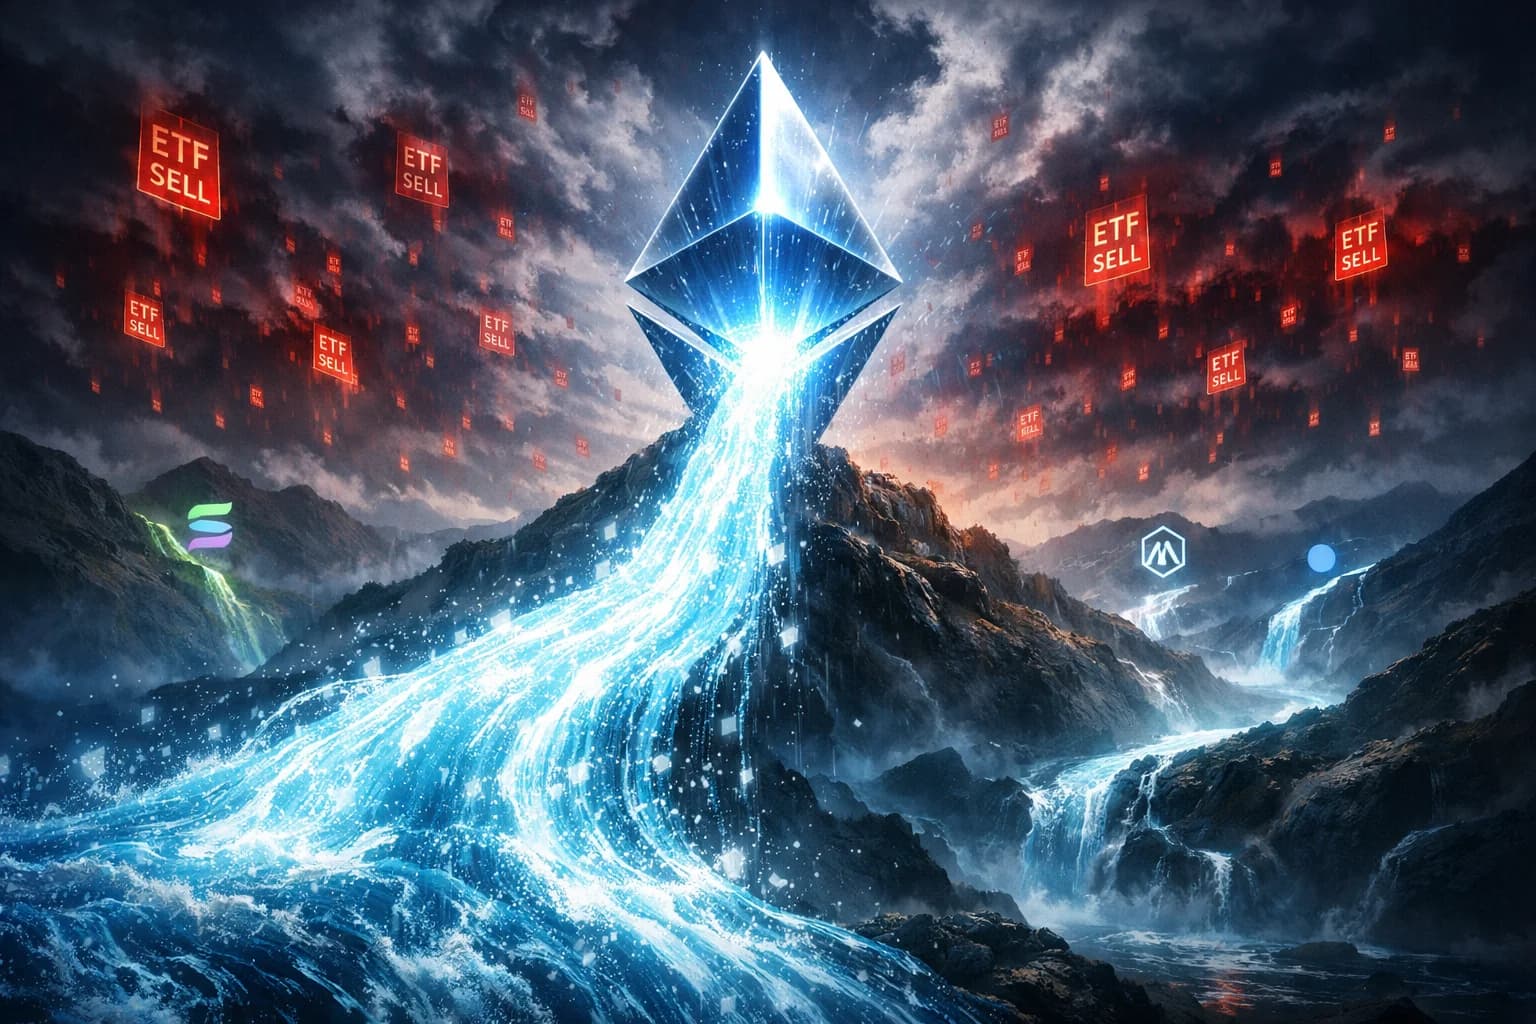
$2.1 Billion Flowing In While $2.76 Billion Flows Out
The divergence between bridge flows and ETF flows is the central tension. Bridge flows measure capital moving between blockchains through DeFi infrastructure. When a user bridges USDC from Solana to Ethereum, or sends assets from Arbitrum back to mainnet, that shows up as an Ethereum inflow in Artemis data. ETF flows, by contrast, measure institutional product demand through regulated financial vehicles tracked by firms like CoinShares.
These two metrics are measuring different populations. ETF investors are largely traditional finance allocators who entered through BlackRock's ETHA and Fidelity's FETH products. Bridge users are DeFi-native participants moving capital across ecosystems based on yield, liquidity, and protocol activity. The fact that these two groups are moving in opposite directions tells us something about who is accumulating and who is capitulating.
Ethereum's 2025 full-year net bridge inflows totaled roughly $4.2 billion, per Artemis data from late December 2025. At $2.1 billion through early March 2026, the network is tracking at a comparable annualized rate, despite operating in a far worse price environment.
Exchange Reserves Hit Record Lows
The on-chain accumulation story extends beyond bridge flows. Ethereum exchange reserves have dropped to 16 million ETH, the lowest level ever recorded. That represents a 30.4% decline from the 23 million ETH sitting on exchanges in 2023, meaning roughly 7 million ETH, worth approximately $14 billion at current prices, has been withdrawn from trading platforms.
When investors move coins off exchanges to personal wallets or staking contracts, it reduces available sell-side supply. This is a classic supply squeeze setup: prices are compressed, but the entities holding ETH are choosing to remove it from places where it could be sold, not adding to sell pressure.
The staking ratio reinforces this pattern. Ethereum's staking rate has crossed 30% in early 2026, with approximately 35.8 million ETH locked in validators and over 1.06 million active validators securing the network. That is 30 cents of every dollar of ETH supply locked into a mechanism that requires weeks to exit, creating structural illiquidity.
Where the Bridge Capital Is Coming From
Artemis bridge flow data for the past three months shows Ethereum mainnet has been a net recipient of capital, reversing a trend seen in late 2025 when $9.3 billion flowed outward, primarily to Layer 2 networks. Of that outflow, roughly $8 billion went to Arbitrum, Base, Starknet, Optimism, and Polygon, with smaller amounts reaching Sui and Solana.
The 2026 reversal suggests that some of that Layer 2 capital is returning to mainnet. This is consistent with what happens during market downturns: users consolidate assets on the most liquid, most secure chain. Ethereum mainnet has the deepest DeFi liquidity, the largest stablecoin reserves (over $102 billion in USDT alone, per Tether data from late 2025), and the settlement guarantees that Layer 2s inherit but do not independently provide.
Aave, the largest lending protocol, recently hit record monthly active users at 155,000, suggesting that DeFi activity on Ethereum is growing even as speculative trading volume migrates to Solana and other chains.
What ETH Holders and DeFi Users Should Watch
The bridge flow metric is not a price indicator. Capital flowing into Ethereum through bridges does not mean ETH will rally tomorrow. It means that DeFi participants are choosing Ethereum as the destination for their assets, which is a usage signal, not a trading signal.
For holders of staking-linked cards or anyone earning yield on staked ETH, the 30% staking ratio creates a structural floor for validator demand. The Ethereum Foundation itself staked 70,000 ETH in January 2026, signaling confidence in the network's long-term economics. Staking yields currently sit around 3.5-4%, which is competitive with traditional fixed income in a falling rate environment.
The ETF outflow data matters for a different reason. If institutional products continue shedding capital, the redemption pressure creates selling at the custodian level (Coinbase Custody for ETHA, Fidelity Digital Assets for FETH). That sell pressure operates independently of on-chain accumulation and can suppress prices even when bridge flows are positive.
The $2,000 level, where ETH trades as of March 10, 2026, sits at the intersection of these forces. On-chain supply is shrinking. Bridge capital is arriving. But ETF redemptions keep pushing coins into the market at the custodial layer.
A Settlement Layer That Keeps Attracting Capital
Ethereum's value proposition has shifted. In 2021, it competed on transaction volume with Solana and Avalanche. In 2026, it functions as the settlement and security layer for a network of L2 chains that handle daily activity. The bridge flow data reflects this: capital returns to Ethereum not because gas fees are low or transactions are fast, but because it is where the deepest liquidity pools, the largest lending markets, and the most battle-tested smart contracts live.
The $2.1 billion in net YTD bridge flows puts Ethereum ahead of every chain, including Hyperliquid (which led in speculative trading volume) and Solana (which dominates DEX volume). For users spending crypto through cards linked to Ethereum-based assets, this liquidity depth means better execution, lower slippage, and more protocol options. The self-custody card ecosystem benefits directly from Ethereum's position as the chain where DeFi infrastructure is most mature.
Whether the bridge flow advantage translates into price recovery depends on whether ETF outflows decelerate. The last time Ethereum posted comparable bridge inflows ($4.2 billion in full-year 2025), ETH was trading above $3,200. At $2,000 with the same capital attraction rate, the disconnect is either a buying opportunity or a warning that institutional demand has permanently shifted elsewhere. The bridge data says Ethereum is not losing users. The ETF data says it is losing allocators. Both statements are true at the same time.
Overview
Ethereum leads all blockchains in 2026 year-to-date net capital flows at $2.1 billion, according to Artemis bridge data. This contrasts sharply with $2.76 billion in ETF outflows over four months and a 60%+ price decline from the August 2025 all-time high. Exchange reserves have hit a record low of 16 million ETH, and the staking ratio has crossed 30% with over 1.06 million validators. The data reveals a split: DeFi-native capital is flowing into Ethereum for its liquidity and settlement role, while institutional ETF allocators are exiting. At $2,000 per ETH, the network attracts the same bridge capital rate it did at $3,200+, creating a divergence that will resolve when one side of the flow equation changes direction.